
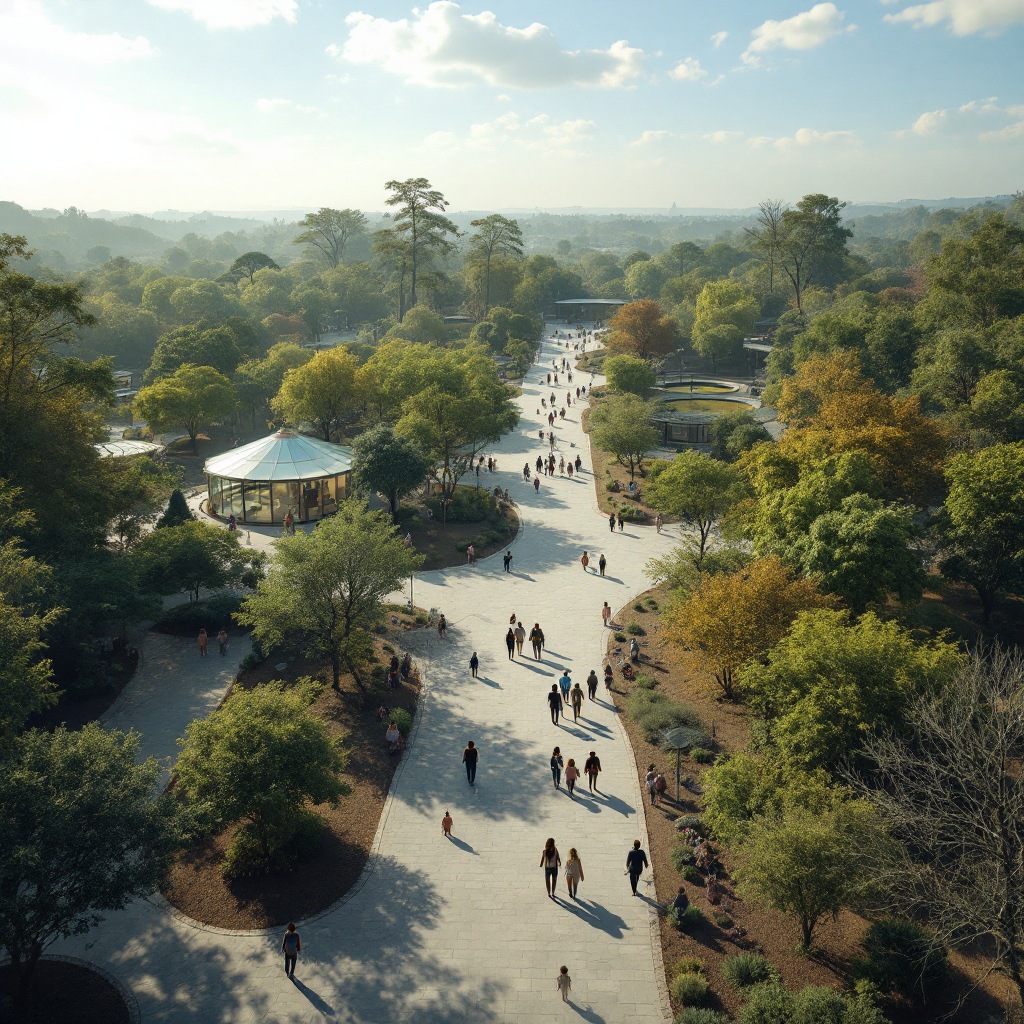
Visitor Flow Patterns in a zoo
Visitor flow describes how people move through a space, and it matters for the design and management of any public attraction. First, visitor flow can follow several common pathway types. For example, a CIRCUIT or loop encourages a round trip past many displays. A linear route leads guests along a main spine. Alternatively, a branching layout creates multiple short loops, which often spreads crowds. Second, average viewing times vary by exhibit type. Studies report that average viewing times range from 3 to 12 minutes per exhibit, which helps planners set pacing and signage. Third, peak hours concentrate around midday, and many zoos observe the highest densities then; planners therefore schedule staff and programs accordingly, as seen in design reviews of multiple institutions evaluating zoo design.
Layout, signage and animal visibility all shape movement. If an enclosure offers clear sightlines, then more visitors stop, linger and return. Conversely, poor sightlines or confusing wayfinding reduce dwell times. In addition, interactive displays and scheduled keeper talks attract clustering. Therefore, planners use maps, color cues and entry sequencing to influence the flow of guests. For instance, directional signage and timed interpretive talks can smooth movement, reduce abrupt congestion, and improve the visitor experience. At the same time, adjustments to pathways affect the behaviour of captive animals. Research has shown that animal responses to visitors can change when foot traffic spikes, so design must balance engagement with welfare “Visitor studies and exhibit evaluation have gained a lot of importance”.
Importantly, operators can measure and act on flow data. Manual counts provide a baseline, and automated people-counting systems add granularity. For example, platforms that convert CCTV into sensor networks let teams monitor footfall in real time, and then react to congestion with staff positioning or alternate routing. Visionplatform.ai supplies tools to convert existing cameras into operational sensors so that managers can manage flow, maintain privacy, and keep data on-premise for EU AI Act readiness. Thus, by combining design, signage and analytics, sites can encourage guests to explore, reduce bottlenecks, and enhance learning while keeping animals comfortable.

Zone Occupancy Metrics in an exhibit
Zone occupancy quantifies how many people occupy a defined space at a given time. It is a critical indicator for crowding and for operational planning. Standard measurement methods include direct observation, interval sampling, and automated counts. For example, researchers often use manual counts at fifteen- or thirty-second intervals to build time-series occupancy profiles. In other cases, RFID or video analytics track entry and exit in real time. One review highlights peak densities that can exceed 50 visitors per 100 square metres in popular displays, which signals potential overcrowding and lower satisfaction.
Occupancy data links closely to visitor satisfaction and dwell time. When zones exceed a comfortable density, visitors report reduced enjoyment and shorter visits to the same area. Conversely, when occupancy remains moderate, dwell times increase and learning outcomes improve. Studies show that underwater viewing exhibits, for instance, hold attention longer and thus change how zones fill over time; this effect is reflected in the longer viewing times measured in some studies (3–12 minutes). Therefore, managers use occupancy thresholds to trigger interventions, such as temporary one-way routing, staff-assisted queuing, or signage encouraging circulation.
From an operational point of view, occupancy metrics also inform cleaning schedules, staffing levels and safety planning. If a particular visitor viewing area peaks at predictable times, then maintenance can be scheduled before those peaks. Similarly, knowing the number of visitors likely in a gallery allows for better emergency egress planning. Analytics that stream events to business dashboards, for example, help schedule shifts and pre-position staff. Visionplatform.ai’s approach to streaming structured events over MQTT supports these uses by turning cameras into sensors so that occupancy counts become actionable metrics. In short, robust zone occupancy measurement improves both the positive visitor experience and the welfare of animals within nearby enclosures.
AI vision within minutes?
With our no-code platform you can just focus on your data, we’ll do the rest
Design Strategies for enclosure and Animal Welfare
Enclosure design must balance visibility, naturalistic features and welfare needs. First, buffer zones reduce direct pressure from crowds. A buffer may include vegetation, raised berms, or indirect viewing platforms. These features allow animals retreat options, which lowers stress. Second, viewing distance and visual barriers matter. Many species show increases in vigilance and shifts in activity budgets when visitors approach too closely. Thus, subtle barriers and graded distances can alter how visitors cluster and how animals respond. In addition, exhibit lighting and sightlines should let visitors engage while giving animals control over their exposure.
Underwater viewing exhibits provide a clear example of design that extends engagement. These displays often yield longer dwell times because they reveal different angles of animal behaviour. Research on underwater viewing shows consistent increases in visitor attention, with viewing times that can reach the higher end of the 3–12 minute range (see Ridgway 2005). As a result, designers must anticipate higher zone occupancy and allow for both crowd dispersal and quiet spaces nearby so that animals can retreat from intense observation.
Careful enclosure layout also reduces negative effects on animal behaviour. For instance, visual barriers can lower repetitive pacing or alertness in some captive animals. In addition, enrichment and off-exhibit holding areas reduce continuous exposure to human presence. Monitoring physiological indicators of welfare alongside behavioural indicators helps teams assess whether design changes are effective. For example, if reductions in crowding coincide with increased foraging or resting, then the design is producing positive outcomes for animal welfare and public engagement. Furthermore, staff training and keeper interactions play a role. When zoo staff manage visitor behaviours gently, both educational goals and welfare outcomes improve. Finally, designers and managers must iterate. Ongoing visitor studies provide feedback, and future research continues to refine strategies for balancing welfare, engagement, and access.
Operational Insights from zoos and aquariums
Operational planning uses visitor flow and occupancy data to optimize staff deployment, maintenance, and safety. First, staffing levels should vary with predictable peak hours. For example, midday peaks often require extra front-line guides and stewards to direct movement and answer questions. Second, maintenance scheduling benefits from occupancy forecasts. Heavy cleaning or exhibit maintenance can be planned for low-traffic windows so that disruption is minimal. Third, emergency egress planning depends on realistic counts of people in each zone; using empirical occupancy data makes evacuation drills more informative.
Comparative studies show regional differences in visitor behaviour. For instance, research that compares Edinburgh and Swiss institutions finds variation in preferences and crowding patterns, which influence how zones are occupied in different contexts comparative study on visitor attitudes. Such differences mean that templates from one location do not always transfer cleanly to another. Therefore, local adaptation is required. Crowd-control measures vary too. Timed entries, one-way circuits and alternative routes are common fixes. Timed entries smooth arrival rates. Alternative routes reduce bottlenecks. In addition, visual and staffed cues help manage visitor behaviours and maintain a positive visitor experience.
Zoos and aquariums also learn from analytics-driven case studies. For example, systems that detect crowding can trigger reallocation of staff or automated messaging to visitors to encourage redistribution. Visionplatform.ai’s platform demonstrates how existing CCTV can become an operational sensor network to stream alerts and analytics without moving data off-site, a helpful model for institutions that need to stay EU AI Act–ready. Additionally, operational plans should include protocols for interactions with visitors. Training for zoo staff on how to de-escalate crowding, how to encourage quiet observation, and how to protect both guests and animals is essential. When implemented together, these operational measures improve safety, enhance conservation education, and support the welfare of animals on view.

AI vision within minutes?
With our no-code platform you can just focus on your data, we’ll do the rest
Tracking Technologies in an aquarium Setting
Modern tracking technologies give managers real-time insights into visitor flows. RFID tags and GPS tracking offer detailed movement traces, while video analytics provide density maps and dwell time estimates. Video-based systems work well indoors and where GPS is unreliable. For example, automated people detection can count entries, log dwell time at a visitor viewing area window, and map heat across galleries. When combined, these tools reveal when and where the number of visitors concentrates, which supports targeted interventions.
Video analytics yield valuable case studies. In several implementations, heatmaps from camera analytics helped sites redistribute foot traffic by adjusting signage and programming. One practical example is the use of people-counting and heatmaps in retail that transfers directly to attractions; similar methods can be used to manage queues and exhibit clustering people-counting and heatmaps. Likewise, crowd-density monitoring solutions used in theme parks show how thresholds can trigger staff alerts or automated messages to visitors to ease pressure on busy zones crowd-density monitoring in theme parks.
Data management and privacy must be addressed. Edge processing keeps video and model training local, which limits external data flows and supports GDPR and EU AI Act readiness. Visionplatform.ai emphasizes on-prem and edge deployments for this reason, allowing institutions to own their data and models. Furthermore, structured event streams can integrate with visitor services and safety workflows. For example, analytics can publish MQTT events to dashboards so that zoo staff react in minutes. Finally, tracking must respect visitor consent and anonymisation norms. Implementations should avoid storing identifying images when counting and should provide clear signage about analytics in use. Overall, careful deployment of tracking technologies improves operations, improves visitor distribution, and safeguards privacy.
Future Trends for Visitor Experience in a zoo
Future trends point toward AI-driven predictions and adaptive infrastructure. First, AI can forecast flow patterns from historical occupancy data and real-time inputs. That capability lets managers change signage dynamically, schedule keeper talks to shift traffic, and open alternative viewing routes when needed. Second, adaptive digital signage and mobile prompts can nudge visitors to underused zones, which balances traffic and lengthens engagement across the site. Third, immersive designs that integrate interpretation with conservation messaging help convert attention into action. Sites that combine hands-on exhibits with strong conservation education achieve deeper learning and increased giving.
Policy and research directions matter. EU guidelines for public space management and ongoing PhD studies continue to explore how analytics and human behaviour interact. In particular, future research will test how variable pricing, timed entry and virtual queues affect visiting patterns and the welfare of animals on view. Researchers also explore behavioural change interventions that reduce intense crowding without reducing access. These studies help managers design systems that are ethically sound and operationally efficient.
Finally, sustainability and technology will merge. Cameras used for safety will also feed sensors for operations, maintenance and interpretation. Integration of analytics into business systems turns video into operational data, and so institutions get more value from existing infrastructure. For readers who want technical guidance, our practical resources on video analytics for attractions show how to move from concept to deployment AI video analytics for zoos. In short, the next wave of tools will help sites improve the positive visitor experience, protect the welfare of animals, and strengthen conservation outcomes, while ensuring responsible data use.
FAQ
How is visitor flow measured in practical terms?
Visitor flow is measured using manual counts, interval sampling and automated tools such as video analytics or RFID. These methods provide temporal and spatial data to understand where guests move, how long they stay, and when peaks occur.
What is zone occupancy and why does it matter?
Zone occupancy records how many people are in a specific area at a given time. It matters because high occupancy can reduce satisfaction, increase stress for animals, and complicate safety and maintenance operations.
How long do visitors usually spend at an exhibit?
Viewing time varies by exhibit type, and studies report averages between 3 and 12 minutes per exhibit. Factors such as animal activity and interactive features can lengthen dwell time.
Can design reduce visitor-induced stress on animals?
Yes. Buffer zones, graded viewing distances and visual barriers give animals retreat options and lower stress. Evidence shows that design changes that reduce direct exposure often improve behavioural indicators of welfare.
What technologies help manage crowding in aquariums?
Video analytics, people-counting, RFID and heatmaps help monitor and manage crowding. For practical examples of people-counting deployments, see our guide on people-counting and heatmaps, which illustrates transferable techniques.
Are there privacy concerns with tracking visitors?
Yes. Privacy is a priority and can be managed with edge processing, anonymisation, and clear signage. Keeping data on-premise supports GDPR and EU AI Act alignment while still enabling operational insights.
How do timed entries help with visitor flow?
Timed entries smooth arrivals, reduce spikes at popular exhibits and allow staff to prepare for expected loads. They are effective when combined with signage and alternative route design to distribute guests.
Do regional differences affect visitor behaviours?
Yes. Comparative studies, such as research comparing Edinburgh and Swiss institutions, show that preferences and crowding patterns vary by region. Local adaptation of design and operations is therefore important (comparative study).
How do analytics improve operational decisions?
Analytics convert camera streams into counts, heatmaps and alerts that inform staffing, maintenance timing and safety planning. Integrated event streams can feed dashboards so that decisions are timely and data-driven.
Where can I learn more about video analytics for attractions?
Start with practical resources that show case studies and deployment steps. Our overview of AI video analytics for zoos explains how to turn existing CCTV into operational sensors while keeping data controlled and private.