
application of Real-Time Passenger Flow Analytics
Urban transit teams now capture movement with cameras and edge devices. They turn routine video into immediate insight, and so they act faster. Systems operate in real time to flag high density, and to guide staff or automated signage. For example, tram stops in large cities can process thousands of trips daily, and operators rely on aggregated counts to match service to demand (UITP data). This matching reduces wait, and it raises boarding rates. City teams report quicker turnarounds, and riders report a smoother commute.
Practical application starts with camera feeds and simple rules. Then, models count heads and predict short-term peaks. The workflow sends alerts to controllers, and it updates schedules in the control room. Visionplatform.ai converts existing CCTV into an operational sensor network so video becomes measurable events. That approach keeps processing local, and it avoids pushing footage into third-party clouds. The local model path helps teams meet compliance needs while they keep full control of models and logs.
Case studies show clear gains. One busy corridor reduced average wait by a measurable margin after adjusting tram dwell times and door alignment. Another operator reallocated staff to boarding zones during peak minutes, and boarding throughput rose. Such measures follow tactics recommended in studies that link convenience and reliability to travel choice (OECD). Data streams also support long term planning. They reveal recurring hot spots, and they guide infrastructure changes. For further guidance on camera-driven control at stops, see a practical approach to crowd management with cameras platform crowd management with cameras.
passenger Counting and flow Detection on Tram Platforms
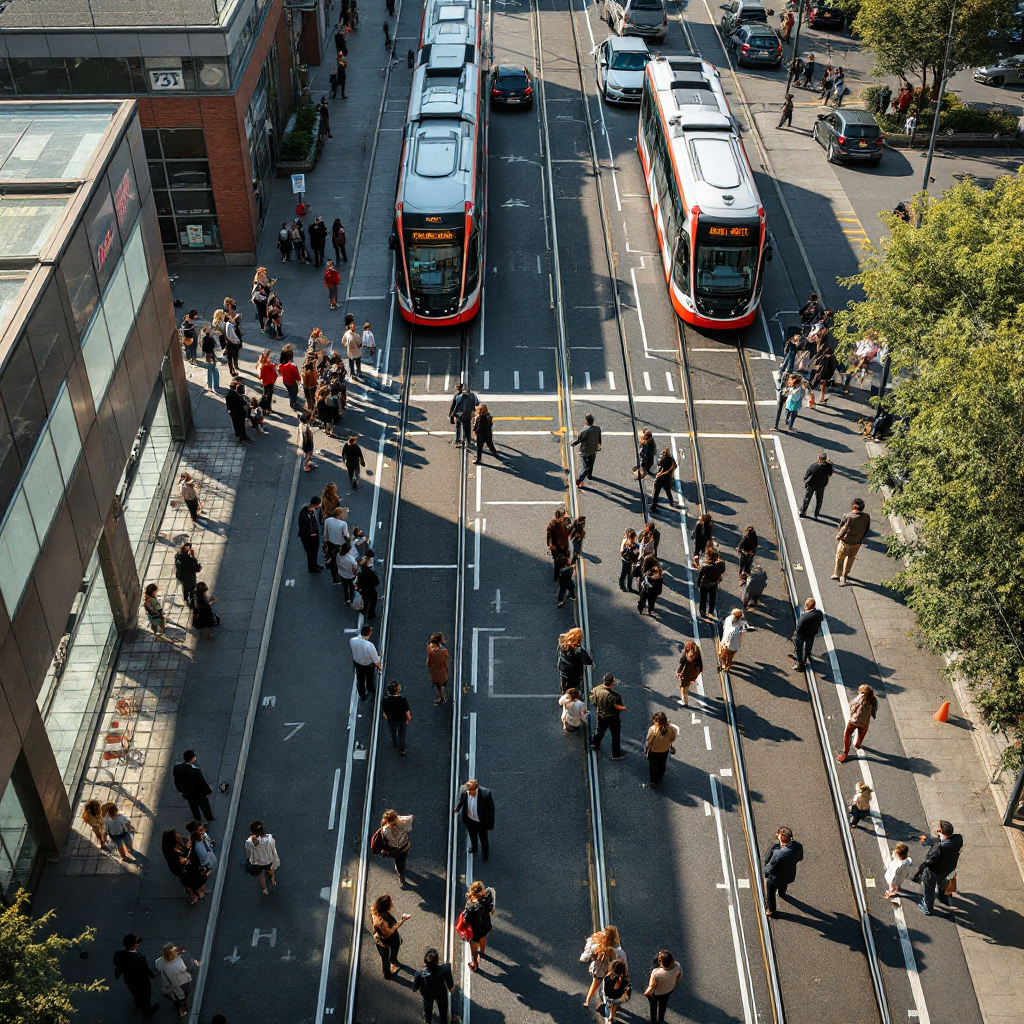
Cameras, lidars, and floor sensors are common tools that count riders and map movement. Computer vision methods detect individuals, and then they track routes across a boarding area. Combining sensors lowers missed detections that occur when people are far from a single camera. One study highlighted missed detections of small groups at the camera far side of narrow stations, and it showed algorithmic gaps that systems must close (Wiley). The same work also reported up to 15% accuracy gains from advanced approaches versus manual counting (accuracy improvements).

Systems typically fuse video detections with simple heuristics. They reject false positives, and they consolidate multiple camera views. That reduces the false alarm rate, and it improves metric quality. Many operators prefer on-prem inference to keep raw footage inside their network. Visionplatform.ai supports this by using VMS video as the training base, and by publishing events over MQTT for dashboards and BI. That makes camera counts usable by operations teams, and it keeps model retraining local for faster iterations.
Design matters. Narrow, elongated boarding zones often create uneven distribution. In some designs, density at a door can be roughly 30% higher than at other doors, and that raises a safety hazard during peaks (platform density study). Targeted camera placement and adaptive algorithms reduce miss rates. They also give staff a clear view of hotspots. For tram depots and operational needs, see tailored analytics for trams and depots AI video analytics for trams and tram depots.
AI vision within minutes?
With our no-code platform you can just focus on your data, we’ll do the rest
data Integration for operation Optimisation
Linking measured counts to control logic enables faster decisions. Data flows from cameras into message buses and then into scheduling engines. Predictive models use historical patterns, weather, and events to suggest adjustments. For prediction, machine learning approaches trained on past demand can forecast short peaks, and then trigger extra vehicle insertions or door priority changes (ML study). Operators then use those signals to change service, and to reduce congestion risk at busy stops.
Integration requires clear APIs and consistent message formats. Many systems publish structured events, and they attach timestamps and location tags. That enables controllers to correlate vehicle arrival with boarding time. It also enables simple automations that change tram dwell policies for a single stop. Visionplatform.ai streams events via MQTT so feeds feed dashboards and OT systems. The approach keeps alerts actionable, and it keeps alarms out of security silos.
Predictive algorithms score demand probability for the next ten to thirty minutes. Then schedulers assign spare vehicles, and control systems nudge dispatch. This short horizon prediction has immediate effect. It cuts crowding and it smooths passenger movement. For station-level rules and station safety features, operators often combine count feeds with gate sensors and staff alerts AI video analytics for train stations. The resulting loop of sensing, prediction, and adjustment improves throughput, and it raises on-time performance.
solution Features for traffic and Congestion Management
Key modules in a modern stack provide alerts, views, and thresholds. Dashboards show live occupancy, and then they show short term trends. Threshold alarms fire when density crosses safety limits, and they message staff or automated signage. A crowd alert module can assign staff to a door, and then it can request a tram to hold doors briefly to space boarding. That method keeps movement orderly, and it reduces risky surges.

Other functional features include segmented counts, dwell analytics, and event tagging. Segmented counts split an area into boarding zones, and they help estimate which doors receive the most load. Dwell analytics track average door open time, and they highlight stops that cause delay. Event tagging links counts to external events so teams can review cause and effect. These modules work together so operators can manage traffic and reduce congestion at critical points.
On narrow boarding areas, automated floor markers and dynamic signage direct riders, and cameras confirm compliance. When a crowd alert hits, staff get a quick route to the hotspot, and they clear obstructions. Systems that integrate with existing VMS reduce deployment friction. For edge safety detection at stops, consider an edge-first approach that preserves privacy and scales with existing cameras platform edge safety detection AI.
AI vision within minutes?
With our no-code platform you can just focus on your data, we’ll do the rest
performance Metrics and key Indicators in Passenger Flow
Operators track throughput and door-level counts as primary metrics. Peak-hour throughput measures how many board in a defined hour, and dwell time shows how long a tram waits at the stop. Platform density quantifies people per square metre, and it feeds safety thresholds. Other KPIs include average wait, queue length, and boarding rate per door. These numbers give teams a clear view of service quality, and they provide targets for improvement.
Transport teams use standard benchmarks to compare stops and routes. For example, an ideal dwell time target helps keep vehicles on schedule. Targeted changes, like repositioning doors or altering boarding protocols, are then evaluated against those KPIs. Teams also combine short term measures with historical trends to understand impact. Historical baselines enable operators to spot anomalies quickly, and then to test fixes.
Dashboards should show both live and aggregated views. Live views support quick response, and aggregated graphs support planning. Alerts tied to KPIs help staff prioritize actions. For airport-style queue analytics and cross-system approaches, teams can repurpose similar methods used in other transport hubs queue analytics for airports. That reuse accelerates deployment and it makes operations more efficient.
year Trends and Feature Roadmaps in Tram Analytics
Recent advances focus on AI at the edge, and on richer sensor fusion. Newer models run on small GPUs, and then they provide detections without sending raw footage to cloud services. This local-first trend supports compliance with privacy rules, and it lowers bandwidth cost. IoT sensors also complement cameras, and they bring redundancy when light or weather degrades optical detection.
Product roadmaps often add smarter alerting and adaptive thresholds. Teams want systems that learn site patterns and then reduce nuisance alerts. Planned upgrades include better model retraining on local footage, and faster interfaces to scheduling systems. These features raise the potential for even more efficient transit control, and they reduce manual work for staff.
Over the next year, expect deeper integrations with dispatch and control. That will move analytics from passive reporting to active control. Vendors will also provide richer APIs and easier model customization so teams can tune detection to their site. Visionplatform.ai focuses on such paths by enabling customers to own their models, and by streaming structured events for operations and BI. The combination of local inference, transparent logs, and simple messaging creates a practical route to smarter, adaptive tram control.
FAQ
What is real-time tram platform passenger flow analytics?
Real-time analytics refers to systems that process visual feeds immediately to deliver counts and alerts. These systems help operators detect surges and react quickly to maintain safety and efficiency.
Which sensors are commonly used for counts?
Cameras dominate, and they are often paired with floor sensors or lidars for redundancy. This fusion increases accuracy and reduces missed detections in complex environments.
How much accuracy improvement can modern methods provide?
Advanced algorithms have shown up to 15% better accuracy over older manual methods in some studies (Wiley). Improved detection of small groups and better multi-angle fusion drive that gain.
Can these systems predict short-term demand?
Yes. Machine learning models trained on historical patterns, weather, and event schedules can forecast near-term peaks. Operators then use those forecasts to adjust service frequency or staff deployment (ML study).
How do operators integrate events into control rooms?
Systems publish structured events with timestamps and location tags to message buses. Controllers then correlate these events with vehicle positions and dispatch actions for quick resolution.
Are privacy and compliance concerns addressed?
Many vendors now offer on-prem and edge processing to keep raw footage inside an organisation. This approach helps teams meet regional privacy rules and maintain control over datasets.
What KPIs should teams monitor first?
Start with peak-hour throughput, average dwell time, and platform density. These reveal immediate bottlenecks and guide targeted interventions.
Do narrow boarding zones pose special challenges?
Yes. Narrow, elongated designs often produce uneven distribution and hotspots. Targeted camera placement and adaptive rules help reduce density imbalances (study).
Can existing CCTV be reused?
Absolutely. Systems like Visionplatform.ai convert existing cameras into operational sensors and publish events for operations. This reuse speeds deployment and lowers cost.
Where can I find more examples of camera-driven operations?
Explore case studies on train and station analytics to see how video feeds power decisions. For train station examples, see AI video analytics for train stations (train stations).